What has the wrapper actually proved?
Your snack has acquired a protein number and the personality of a personal trainer. Three questions are worth separating: how much protein is there; where does it come from; and what is the whole food like? Twenty grams is useful. It is not a complete amino acid profile, a quality score or a verdict on your diet. A car advert can accurately announce four wheels. Awarding it the championship would be a little brisk.
What does “high protein” mean in the UK and EU?
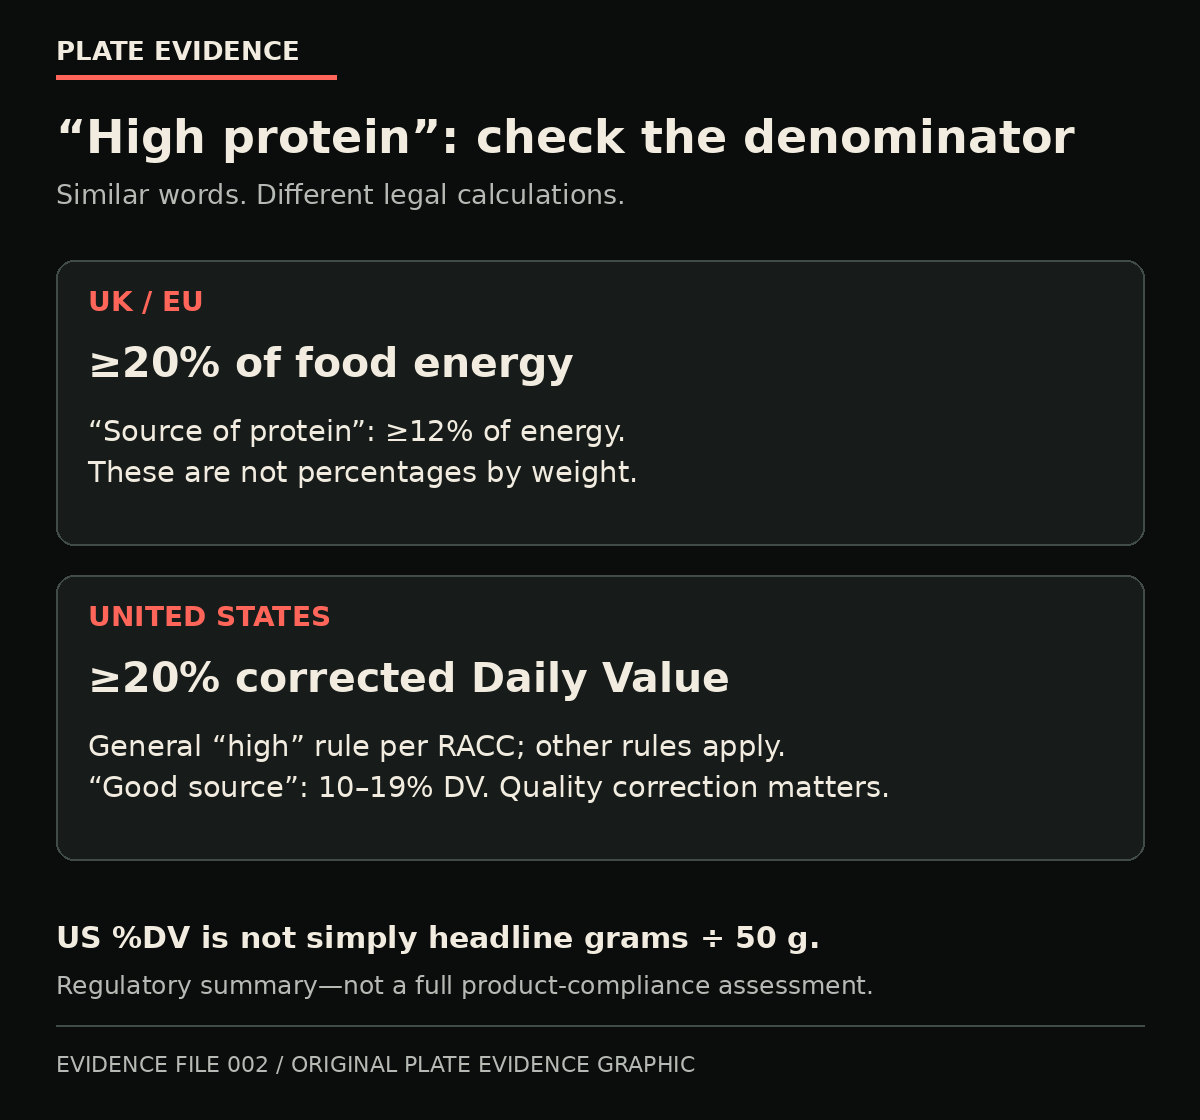
Under the UK and EU nutrition-claims rules, “high protein” means at least 20% of a food’s energy comes from protein. “Source of protein” means at least 12%. Those percentages refer to energy, not the weight of the food.
The threshold tells you protein’s share of the food’s energy. It does not certify every other feature of the product. A claim, not a knighthood.
How do US protein labels work?
In the US, headline protein grams and the protein percent Daily Value (%DV) are not the same number in different outfits. The percentage uses an amino acid score corrected for protein digestibility — a PDCAAS-style quality correction, like a mark after the exam rather than a count of the questions on the paper. Grams are multiplied by that score, capped at 1.00, and a protein claim generally requires the corrected percentage. Dividing headline grams by the general 50 g Daily Value for adults and children aged four and over can miss a step.
US “high” claims generally require at least 20% DV per reference amount customarily consumed; “good source” generally means 10–19% DV. These are not the UK/EU energy percentages — similar signs, different denominators, like two thermometers, one in Celsius and one in Fahrenheit.
| Jurisdiction | “High” | Other claim / calculation |
|---|---|---|
| UK / EU | At least 20% of food energy from protein | “Source of protein”: at least 12% of energy. Neither is a mass percentage. |
| US: general rules | At least 20% corrected protein DV per reference amount customarily consumed (RACC) | “Good source”: 10–19% DV. Corrected grams use a digestibility-corrected amino acid score, capped at 1.00. General adult/4+ DV: 50 g; other rules and population values apply. |
Sources: Regulation 1924/2006, Annex; European Commission nutrition-claims list; 21 CFR 101.9(c)(7) and 101.54. Summary only—not a complete compliance test or a personal protein target.
Is all protein the same?
Proteins are chains of amino acids, and different sources supply different building blocks. The bar does not travel intact into your biceps. A rise in blood amino acids demonstrates delivery, not an increase in every tissue outcome.
What did the three laboratory experiments measure?
The table below sets out three short studies of protein after exercise. None tested a finished retail bar, or long-term muscle, joint or skin outcomes.
In 2023, Aussieker and colleagues studied 45 young recreational athletes (30 men, 15 women). After resistance exercise, groups of 15 received 30 g whey, 30 g collagen or placebo, over roughly five hours. Whey raised myofibrillar protein synthesis — the making of proteins involved in muscle contraction — versus placebo. Collagen did not differ significantly from placebo, or from whey. Neither protein significantly increased measured muscle-connective synthesis versus placebo. A significant result against placebo plus a non-significant one is not a proven difference between the two proteins — statistics with a borrowed gym pass.
In 2025, 45 young adults received 30 g hydrolysed collagen, 30 g matched amino acids, or placebo, followed for six hours after one-leg exercise. Blood amino acids rose — the delivery truck arrived — but measured synthesis did not increase versus placebo. Biopsy numbers varied. A later paper (online 2024, 2025 issue) found that 25 g whey plus 5 g collagen raised myofibrillar synthesis versus placebo over five hours, in 28 young men. There was no whey-only group, so it cannot show that adding collagen helped.
The three experiments, side by side
| Experiment | People and comparison | Measured result | Boundary |
|---|---|---|---|
| Aussieker 2023 · about 5 hours | 45 young recreational athletes; 30 g whey vs 30 g collagen vs placebo after exercise. | Myofibrillar synthesis: whey higher than placebo; collagen did not differ significantly from placebo or whey. | No significant whey–collagen difference established. Neither protein significantly increased measured muscle-connective synthesis vs placebo. No disputed numerical synthesis means plotted. |
| Aussieker 2025 · 6 hours | 45 allocated; 30 g collagen vs 30 g matched free amino acids vs placebo. Biopsy-analysis numbers varied. | Blood amino acids rose; neither intervention significantly increased measured myofibrillar or muscle-connective synthesis vs placebo. | Delivery is not a demonstrated synthesis increase. Nonsignificance is not proof of zero biological effect. |
| Blend · 2025 issue, online 2024 · 5 hours | 28 young men; 25 g whey + 5 g collagen vs placebo. | Higher myofibrillar synthesis in rested and exercised legs vs placebo. | No whey-only arm: cannot establish collagen’s added benefit over whey alone. |
Original qualitative synthesis of the three papers linked below. The papers share a research network, not three fully independent replications. Acute synthesis is not long-term muscle, joint or skin evidence; none tested a finished retail bar.
Who funded the studies?
These papers share a research network. They are not three independent replications.
- The 2023 paper discloses author and laboratory industry relationships.
- The 2025 collagen paper reports Maastricht–Tessenderlo public–private cooperation, laboratory/coauthor industry relationships and a declared GELITA grant for a coauthor.
- The blend paper reports Maastricht/GELITA/TKI Health–Holland funding, an author employed by GELITA and further declared relationships.
Industry funding does not automatically invalidate a finding. It is a reason to examine design and independent replication.
How should you read a protein-bar packet?
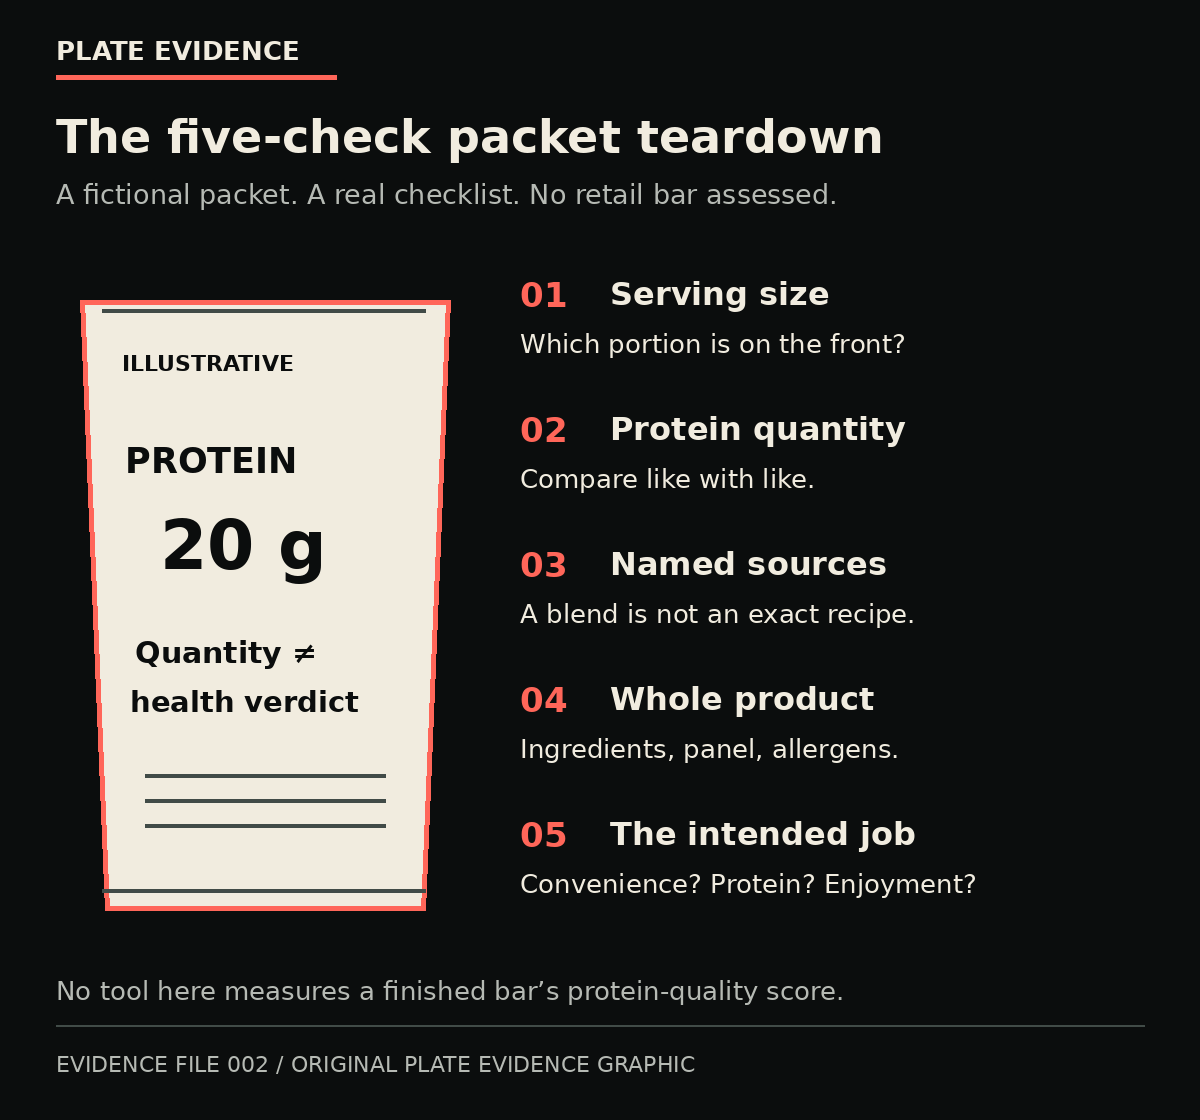
- Serving size. Is the front number for one bar, a portion or another amount?
- Protein quantity. Read the amount for the portion you will actually eat.
- Named protein sources. Whey, milk proteins, soy, other plant proteins and collagen are not identical mixtures. Ingredient order usually cannot reveal exact blend proportions or a quality score.
- The rest of the product. Sugar, saturated fat, fibre, salt and allergens do not disappear because “protein” has been printed larger.
- The job you want it to do. Convenience, enjoyment and a protein contribution are different purposes.
If a blend is claimed to do something special, ask for evidence on that blend at that dose. None of these experiments tested finished retail protein bars.
What has the wrapper proved — and what has it not?
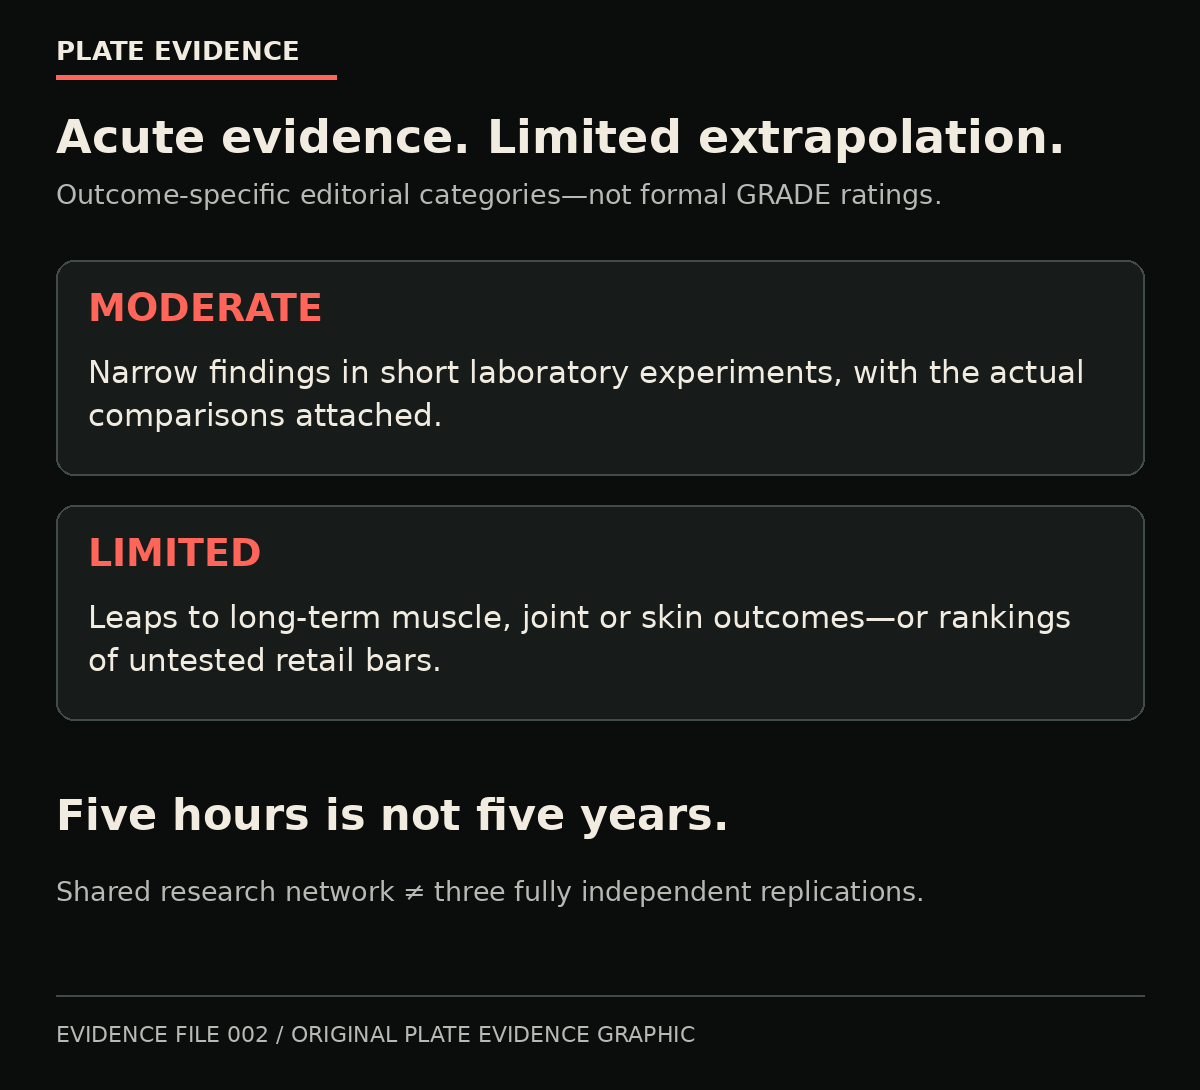
The UK/EU protein-energy definitions and the US corrected-Daily-Value framework are official regulatory records. The eCFR is authoritative but unofficial. The narrow acute findings are moderate. Extrapolation to long-term muscle, joint or skin outcomes, or ranking untested retail bars, is limited. These are editorial categories, not official GRADE assessments. Keep the number. Lose the halo.
Questions from the label desk
Does 20 g of protein make a bar healthy?
No. It states a quantity, not a complete amino acid profile, finished-product quality score or assessment of the whole food. Consider quantity, source and the rest of the product separately.
What does “high protein” mean in the UK and EU?
At least 20% of the food’s energy must come from protein. “Source of protein” requires at least 12%. These are energy proportions, not percentages by weight.
Did the 2023 study prove whey was significantly better than collagen?
No. Whey differed significantly from placebo, but collagen did not differ significantly from either placebo or whey. A difference between significance labels is not itself a significant difference between treatments.
Did the blend study prove that adding collagen improved whey’s effect?
No. The whey-plus-collagen blend increased myofibrillar synthesis versus placebo, but there was no whey-only arm. It cannot establish collagen’s added benefit over whey alone.
Were finished retail protein bars tested in these studies?
No. These were short laboratory protein interventions, not retail bar comparisons. They cannot rank finished bars or settle long-term muscle, joint or skin outcomes.
Watch the Plate Evidence investigation
The matching film is now available on @PlateEvidence. The written investigation, primary sources and caveats stand on their own.
Watch on YouTube ↗Primary sources and regulatory records
- UK: Regulation 1924/2006, Annex — protein claims.
- European Commission: permitted nutrition claims.
- US: 21 CFR 101.9(c)(7) — protein labelling and corrected %DV.
- US: 21 CFR 101.54 — general “high” and “good source” rules.
- Aussieker et al., 2023 — whey, collagen and placebo. DOI: 10.1249/MSS.0000000000003214.
- Aussieker et al., 2025 — collagen and matched free amino acids. DOI: 10.1249/MSS.0000000000003788.
- Aussieker et al., 2025 issue (online 2024) — whey/collagen blend. DOI: 10.1249/MSS.0000000000003596.
Research and label commentary, not personalised medical, dietary or legal advice. No retail brand is assessed or ranked. The illustrative calculation is not a tested product. Acute synthesis findings do not establish long-term muscle, joint or skin effects.